Showing posts with label Level Design. Show all posts

Sunday, 23 February 2020

The Cacophony Index

Can we estimate the health of an ecosystem from a digital audio recording?
(Part 2 in a series about Artificial Intelligence and New Zealand native birds.)


Inside a computer, 20 seconds of audio are represented by a sequence of 320,000 numbers.
20 seconds of audio, plotted as a waveform
Our challenge is to take that series of 320,000 numbers and extract one single number, a "Cacophony Index", that has some special properties:
  • Birds nearby and birds far away increase the Index about the same.
  • Background noises don't affect the Index very much.
  • The Cacophony Index for two sparrows chirping should be higher than if there's only one.
  • The Cacophony Index for a sparrow chirping and an owl hooting should be higher than for two sparrows chirping.

Wow, that’s a really hard thing to do! As happens often in this blog, we'll make the problem easier by adding in some assumptions:
 "Perfect is the enemy of good" - Voltaire

Are we justified in making all these assumptions?

 ...Well, no...
...but...         
... let's do it anyway.

Lets build something useful instead of freaking out that a perfect solution can't exist.

That means we're going to just ignore a whole bunch of nasty complications like “clipping”, “nyquist rate”, “attenuation”, “noise floor”, etc


Because PROGRESS!
  • Most of the loud noises in the recordings are birds, not people or cars or machines.
  • The recording is “clean”
  • The birds and the recorder stay in the same place.
  • No running water or ocean waves (!)
  • The recording was taken in New Zealand (!!)


Great stuff! Lets look at the spectrogram:

The spectrogram is a visual representation of the spectrum of frequencies of a signal as it varies with time. 

We don’t care so much about the intensity of any given bird call, that mostly tells us how near or far the bird is.

We don’t care so much if the bird has a short call or a long call.

Background noise? That’s where the spectrogram is well.. noisy..
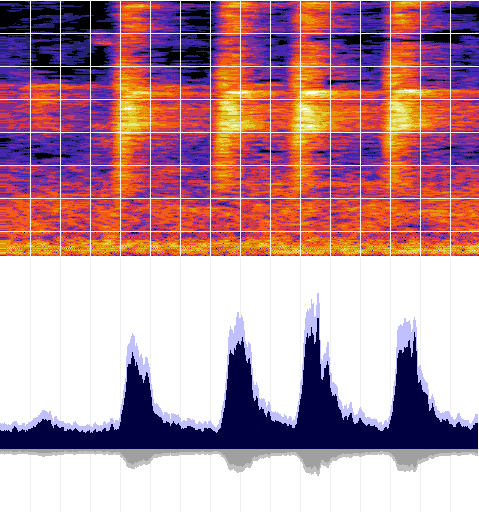
Count the number of times a yellow box is next to a blue box!
That's the heart of the Cacophony Index calculation.

What we’re really looking for is how the spectrogram changes over time.

Lets zoom in on that starting second and add a grid to isolate the signal in both time and frequency:

A little bit more math and we find the cacophony index for this particular audio recording is: 77

OK, you got me, I'm oversimplifying again!  ¯\_(ツ)\_/¯ If you want all the gory details, the code is on github.com


Lets talk Birds!

The Cacophony Index for 20 seconds of audio is just a number between zero and one hundred. By itself, not super useful.

If we make many recordings in the same location, we can plot how the Cacophony Index changes over time.  Here's one possible presentation of what that might look like over the course of a day:

You can clearly see the birds are more active during the day and less active during the night. The birds getting really noisy around sunrise and sunset, the "Dawn Chorus".

Even though the plot is a mock-up, the data is real. It's data from a real bird monitor, recorded near Christchurch, New Zealand over a three week period in November of 2019. We now have the technology to see how the Cacophony Index changes over a day, or a week, or even seasons, years or decades.

And that's exactly what the Cacophony Project are doing, using real audio recorded right here in New Zealand, uploaded continuously and automatically by people just like you! (Edit: Live! Check it out!)

I think that's awesome. Can we go deeper?

Now we have an automated way to track an ecosystem's health, what else can we do with the audio data?

Watch this space for an update using real AI using Tensorflow and some real world ethical problems.

Thursday, 30 January 2020

Engineering in the Native Forest

Part 1 in a 2 part series about Artificial Intelligence and New Zealand native birds.

We’ve all heard that sound, and it is glorious. Native birds singing in pristine native forest.
NZ Southern Island forest

Then tragedy happens. It could be an introduced pest like possums or rats. Maybe the climate changes and the native birds cannot adapt. Maybe it’s just a really really really bad year for bird flu.

The once vibrant healthy forest falls quiet. The native bird population is in crisis.

Meanwhile, over on social media:

I think it’s awesome when people are passionate about their local environment. I think it’s amazing when folks break out of their comfort zone and try to bring about positive change.

We all know that blindly doing the first thing that pops into your head is rarely the best course of action. Even with the best of intentions, when it comes to the environment, there’s just far too many ways to make the situation worse.

Fortunately, we can use Engineering!

  • First, we measure the health of an ecosystem.

  • Next, we apply an intervention:
    • pest trapping
    • a breeding program
    • fences
    • [Your idea here]
  • Then, we measure the health of the ecosystem a second time.

Mix in a little bit of math, and now we can figure out which interventions are the most effective.

Those interventions which are more (cost) effective? We'll do more of those.

The interventions which have no effect, or worse, are damaging? Well, let's not do that again!

Simple right?

Well how do we measure ecosystem health?

Right now, in New Zealand, the gold standard is a manual process. Listeners walk out into the forest, and for five minutes, makes a record of all the birds they can hear on a piece of paper. Those pieces of paper are all brought together and another person manually enters all that data into a computer.

What if there was a way to estimate ecosystem health directly from an audio stream instead? Then we could leave recorders out in the forest, and monitor them remotely. More data, more timely, more consistency.

I'm good with computers and signal processing and things, maybe I can help...

Find out more over on the 2040 blog, or read Part 2

Thursday, 24 January 2013

Easy Mode Unlocked

One of the hardest thing to do when making a game, is to balance the difficulty.

Of course, at the start, you want your game to be as accessible as possible.  Then, over time, as the player progresses, you smoothly ramp up the difficulty to keep the player engaged.

Today I wanted to focus on the beginning of that : Just how easy is easy?

Easy for Me

The natural instinct of the indie developer is to make the first level really easy for themselves.  It turns out that's not a fair test.  You've been playing the game for a while now and you know all the controls and every obstacle.  You need to look elsewhere, to someone who's never played the game before.

Easy for You

The next step is to focus test.  Find everyone you know, especially your friends, who don't play games that much.  And then make it easy for them.  As you go through this process you'll find your game becomes more and more accessible and the learning curve becomes more and more navigable.

Easy for Everyone

But can we do even better than that?

If you watch young kids playing games on a tablet, you'll know how engaging they can be.  And frustrating too, with the constant restarts, and the accidental taps on adverts and in-game consumables.

Zen Arcade

In keeping with this spirit, this morning I added a special "Zen Arcade" mode to my next game:

There's no enemies or time pressure.  There's no way to lose.  It's just a calming, peaceful experience that anyone can play and enjoy.

I even made the pause button a little smaller to avoid accidental clicks, and removed the options to use the power ups.

What tips and tricks do you use to increase accessibility of your game?  Why not let me know in the comments below!

Saturday, 19 January 2013

Level Design

Today it's all about levels!

(click through for larger version)