Sunday 23 February 2020

The Cacophony Index

Can we estimate the health of an ecosystem from a digital audio recording?
(Part 2 in a series about Artificial Intelligence and New Zealand native birds.)


Inside a computer, 20 seconds of audio are represented by a sequence of 320,000 numbers.
20 seconds of audio, plotted as a waveform
Our challenge is to take that series of 320,000 numbers and extract one single number, a "Cacophony Index", that has some special properties:
  • Birds nearby and birds far away increase the Index about the same.
  • Background noises don't affect the Index very much.
  • The Cacophony Index for two sparrows chirping should be higher than if there's only one.
  • The Cacophony Index for a sparrow chirping and an owl hooting should be higher than for two sparrows chirping.

Wow, that’s a really hard thing to do! As happens often in this blog, we'll make the problem easier by adding in some assumptions:
 "Perfect is the enemy of good" - Voltaire

Are we justified in making all these assumptions?

 ...Well, no...
...but...         
... let's do it anyway.

Lets build something useful instead of freaking out that a perfect solution can't exist.

That means we're going to just ignore a whole bunch of nasty complications like “clipping”, “nyquist rate”, “attenuation”, “noise floor”, etc


Because PROGRESS!
  • Most of the loud noises in the recordings are birds, not people or cars or machines.
  • The recording is “clean”
  • The birds and the recorder stay in the same place.
  • No running water or ocean waves (!)
  • The recording was taken in New Zealand (!!)


Great stuff! Lets look at the spectrogram:

The spectrogram is a visual representation of the spectrum of frequencies of a signal as it varies with time. 

We don’t care so much about the intensity of any given bird call, that mostly tells us how near or far the bird is.

We don’t care so much if the bird has a short call or a long call.

Background noise? That’s where the spectrogram is well.. noisy..
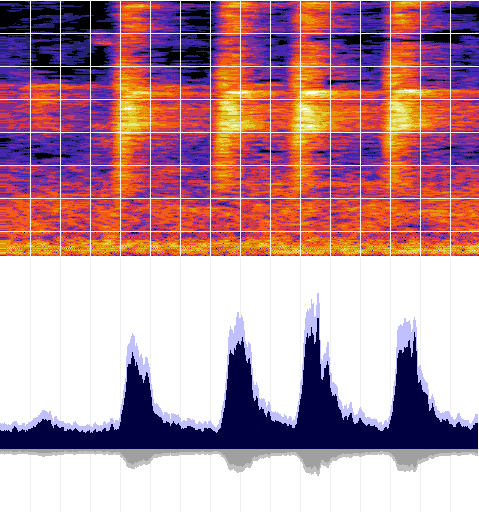
Count the number of times a yellow box is next to a blue box!
That's the heart of the Cacophony Index calculation.

What we’re really looking for is how the spectrogram changes over time.

Lets zoom in on that starting second and add a grid to isolate the signal in both time and frequency:

A little bit more math and we find the cacophony index for this particular audio recording is: 77

OK, you got me, I'm oversimplifying again!  ¯\_(ツ)\_/¯ If you want all the gory details, the code is on github.com


Lets talk Birds!

The Cacophony Index for 20 seconds of audio is just a number between zero and one hundred. By itself, not super useful.

If we make many recordings in the same location, we can plot how the Cacophony Index changes over time.  Here's one possible presentation of what that might look like over the course of a day:

You can clearly see the birds are more active during the day and less active during the night. The birds getting really noisy around sunrise and sunset, the "Dawn Chorus".

Even though the plot is a mock-up, the data is real. It's data from a real bird monitor, recorded near Christchurch, New Zealand over a three week period in November of 2019. We now have the technology to see how the Cacophony Index changes over a day, or a week, or even seasons, years or decades.

And that's exactly what the Cacophony Project are doing, using real audio recorded right here in New Zealand, uploaded continuously and automatically by people just like you! (Edit: Live! Check it out!)

I think that's awesome. Can we go deeper?

Now we have an automated way to track an ecosystem's health, what else can we do with the audio data?

Watch this space for an update using real AI using Tensorflow and some real world ethical problems.

Thursday 30 January 2020

Engineering in the Native Forest

Part 1 in a 2 part series about Artificial Intelligence and New Zealand native birds.

We’ve all heard that sound, and it is glorious. Native birds singing in pristine native forest.
NZ Southern Island forest

Then tragedy happens. It could be an introduced pest like possums or rats. Maybe the climate changes and the native birds cannot adapt. Maybe it’s just a really really really bad year for bird flu.

The once vibrant healthy forest falls quiet. The native bird population is in crisis.

Meanwhile, over on social media:

I think it’s awesome when people are passionate about their local environment. I think it’s amazing when folks break out of their comfort zone and try to bring about positive change.

We all know that blindly doing the first thing that pops into your head is rarely the best course of action. Even with the best of intentions, when it comes to the environment, there’s just far too many ways to make the situation worse.

Fortunately, we can use Engineering!

  • First, we measure the health of an ecosystem.

  • Next, we apply an intervention:
    • pest trapping
    • a breeding program
    • fences
    • [Your idea here]
  • Then, we measure the health of the ecosystem a second time.

Mix in a little bit of math, and now we can figure out which interventions are the most effective.

Those interventions which are more (cost) effective? We'll do more of those.

The interventions which have no effect, or worse, are damaging? Well, let's not do that again!

Simple right?

Well how do we measure ecosystem health?

Right now, in New Zealand, the gold standard is a manual process. Listeners walk out into the forest, and for five minutes, makes a record of all the birds they can hear on a piece of paper. Those pieces of paper are all brought together and another person manually enters all that data into a computer.

What if there was a way to estimate ecosystem health directly from an audio stream instead? Then we could leave recorders out in the forest, and monitor them remotely. More data, more timely, more consistency.

I'm good with computers and signal processing and things, maybe I can help...

Find out more over on the 2040 blog, or read Part 2

Friday 18 October 2019

ShiftP

Buddy of mine wants to straighten some images automatically, kinda like ShiftN :


Oh, you'll want Python version 2, I said:
#makefile
PIP2=pip
PYTHON2=python

setup2:
$(PIP2) install --user virtualenv
$(PYTHON2) -m virtualenv v2
source v2/bin/activate && pip install numpy Pillow pylsd

And Python 3, I said, also in a VirtualENVironment sandbox:
#makefile
PIP3=pip3
PYTHON3=python3

setup3:
#$(PYTHON3) -m venv v3
source v3/bin/activate && pip install numpy Pillow scipy

setup: setup2 setup3
-mkdir temp

run:
source v2/bin/activate && python FindLines.py Source.jpg

source v3/bin/activate && python Warp.py

Start by finding all your lines:
#FindLines.py
import json
import numpy
import sys

from PIL import Image
import pylsd.lsd

def ExportMeta(fileName,outName):
meta={'fileName':fileName}
image=Image.open(fileName)
meta['width']=image.width
meta['height']=image.height
grayScale=numpy.asarray(image.convert('L'))
lines=pylsd.lsd(grayScale)
lineArray=[]
for row in lines:
lineArray.append(list(row))
meta['lineArray']=lineArray

with open(outName,'w') as f:
f.write(json.dumps(meta,sort_keys=True,separators=(',', ': '),indent=4))


ExportMeta(sys.argv[1],'temp/meta.json')
Always prefilter your inputs, I nagged:
#Warp.py
def FindWeightedLines(lineArray,meta):
linesHorizontal=[]
linesVertical=[]
for (x0,y0,x1,y1,width) in lineArray:
if width<2:
continue
h0=RemapXY(x0,y0,meta)
h1=RemapXY(x1,y1,meta)
dx=abs(h0[0]-h1[0])
dy=abs(h0[1]-h1[1])
if max(dx,dy)<min(dx,dy)*4:
continue
magnitude=dx*dx+dy*dy
if dx<dy:
linesHorizontal.append([magnitude,h0,h1])
else:
linesVertical.append([magnitude,h0,h1])

return sorted(linesHorizontal)[-30:]+sorted(linesVertical)[-30:]
#Always prefilter your inputs!!!

Now here's the tricksy bit, in *TWO* parts, setup a perspective transform:
#Warp.py
def RemapXY(x,y,meta):
xx=(x-meta['width']/2)/meta['scale']
yy=(y-meta['height']/2)/meta['scale']
return (xx,yy,1)

def UnmapXYZ(xx,yy,zz,meta):
rx=xx/zz
ry=yy/zz
x=rx*meta['scale']+meta['width']/2
y=ry*meta['scale']+meta['height']/2
return (x,y)

*And* a non-linear warp. We don't need the full power of Chebyshev Polynomials here, I reminded him. We can just use 0, 1, x, y, x2, y2 and xy. Why? Because all spanning basis-es are equivalent in low dimensions!
#Warp.py
def ApplyTransform(transform,x,y,z):
rx=x*transform[0]+y*transform[1]+z*transform[2]
ry=x*transform[3]+y*transform[4]+z*transform[5]
rz=x*transform[6]+y*transform[7]+z*transform[8]
nonLinear=True
if nonLinear:
rx+=x*y*transform[9]
ry+=x*y*transform[10]
rx+=x*x*transform[11]
ry+=x*x*transform[12]
rx+=y*y*transform[13]
ry+=y*y*transform[14]
return (rx,ry,rz)

def ApplyTransformhomogenous(transform,x,y,z):
(hx,hy,hz)=ApplyTransform(transform,x,y,z)
return (hx/hz,hy/hz)

Next you'll need a loss function, weakly constrain your transform matrix, then setup a sum-of-squares for your error term:
#Warp.py
def loss(transform,meta):
result=0
for i in range(9):
t=transform[i]
if i==0 or i == 4 or i == 8:
t=transform[i]-1
result += t*t

for(weight,h0,h1) in meta['weightedLineArray']:
(x2,y2)=ApplyTransformHomogenous(transform,*h0)
(x3,y3)=ApplyTransformHomogenous(transform,*h1)
dx=abs(x3-x2)
dy=abs(y3-y2)
if dx<dy:
(dx,dy)=(dy,dx)
q=math.sqrt(dx*dx + dy*dy)
dx=dx/q
dy=dy/q

result += dy*dy

Are we done yet? Oh, a driver...:
#Warp.py
def Main():

with open('temp/meta.json','r') as f:
meta=json.loads(f.read())
meta['scale']=math.sqrt(meta['width']*meta['height'])/2

meta['weightedLineArray']=FindWeightedLines(meta['lineArray'],meta)

m=minimize(loss,[1,0,0,0,1,0,0,0,1,0,0,0,0,0,0],args=meta)

transform=m.x

(x0,y0,x1,y1) = FindClipRectangle(...)

source=Image.open(meta['fileName'])
image=Image.new('RGB',(x1-x0,y1-y0),(0,0,0))
draw=ImageDraw.Draw(image)
meta['splitCount']=64
for x in range(meta['splitCount']):
for y in range(meta['splitCount']):
p00=SquareMap(x,y,meta)
p01=SquareMap(x,y+1,meta)
p10=SquareMap(x+1,y,meta)
p11=SquareMap(x+1,y+1,meta)

r00=ApplyTransform(transform,*RemapXY(*p00,meta))
r01=ApplyTransform(transform,*RemapXY(*p01,meta))
r10=ApplyTransform(transform,*RemapXY(*p10,meta))
r11=ApplyTransform(transform,*RemapXY(*p11,meta))
s00=UnmapXYZ(*r00,meta)
s01=UnmapXYZ(*r01,meta)
s10=UnmapXYZ(*r10,meta)
s11=UnmapXYZ(*r11,meta)
TextureMapTriangle(draw,x0,y0,x1,y1,source,s00,s01,s10,p00,p01,p10)
TextureMapTriangle(draw,x0,y0,x1,y1,source,s10,s01,s11,p10,p01,p11)
print('Progress %d/%d'%(x,meta['splitCount']),flush=True)

image.save('temp/warped.jpg')

Oh, and you need texture mapped triangles? Python is terrible for that, there's no way to make it run fast.... Fine, here's one of those, just to get you started, but don't blame me if it's slow, this needs to be in OpenGL or something so you can run it on the GPU and apply proper gamma correction.

#TextureMapTriangle.py
def Left(p,a,b):
cross=(p[0]-a[0])*(b[1]-a[1])-(p[1]-a[1])*(b[0]-a[0])
return cross<0

def SampleMap(source,x,y,dx,dy):
if x<0:
x=0
if y<0:
y=0
if x>=source.width:
x=source.width-1
if y>=source.height:
y=source.height-1
return source.getpixel((x,y))


def TextureMapTriangle(draw,x0,y0,x1,y1,source,p0,p1,p2,uv0,uv1,uv2):
xy0=list(map(min,zip(p0,p1,p2)))
xy1=list(map(max,zip(p0,p1,p2)))

dx1=p1[0]-p0[0]
dy1=p1[1]-p0[1]
dx2=p2[0]-p0[0]
dy2=p2[1]-p0[1]
det=dx1*dy2-dx2*dy1
if xy0[0]<x0:
xy0[0]=x0
if xy0[1]<y0:
xy0[1]=y0
if xy1[0]>x1:
xy1[0]=x1
if xy1[1]>y1:
xy1[1]=y1

for x in range(math.floor(xy0[0]),math.ceil(xy1[0])):
for y in range(math.floor(xy0[1]),math.ceil(xy1[1])):
p=(x,y)
if Left(p,p0,p1):
continue
if Left(p,p1,p2):
continue
if Left(p,p2,p0):
continue

dx=x-p0[0]
dy=y-p0[1]
u=(dx*dy2-dy*dx2)/det
v=(-dx*dy1+dy*dx1)/det

uu=uv0[0]+u*(uv1[0]-uv0[0])+v*(uv2[0]-uv0[0])
vv=uv0[1]+u*(uv1[1]-uv0[1])+v*(uv2[1]-uv0[1])
c=SampleMap(source,uu,vv,1,1)
draw.point((x-x0,y-y0),tuple(c))


And then you could be like me, and license all of the above code under CC0. Yay!

Thursday 10 May 2018

Duplex


Duplex. That’s the technology at Google I/O 2018 where an AI agent can use the existing telephone network to call a restaurant, book a table for 4 at 7pm, and adapt to common problems.

Things get more interesting when the restaurant runs a similar service. AI talking to AI.

Whenever two learning AI’s get together, every single time, they develop a new language. One that us humans can’t understand.

I can imagine the following “conversation”: Alice, a digital assistant, is calling Bob, an AI agent for the restaurant.

  Alice and Bob together: Hi

  Alice: Umm, er, hmmm, yes?

  Bob: Table confirmed, 4 people, tonight at 7pm.

  Alice and Bob together: Bye

Lets slow that recording down and play it back again, annotated this time:

  Alice and Bob together: Hi
       Handshake protocol, are we both digital software? Yes we are.

  Alice: Umm, er, hmmm, yes?
       Translation: I’d like to book a table for 4 people anytime between 6pm and 9pm

  Bob: Table confirmed, 4 people, tonight at 7pm.
       Lets repeat everything for the recording the humans will review.

  Alice and Bob together: Bye
       Handshake protocol, confirm booking.


Are there new words the AI can teach us? More efficient grammatical structures? Can the AI teach us humans to communicate more effectively?

If there is, the AI won’t tell us.

Unless we know how to ask.

Friday 14 April 2017

Basic Income, Better Living Through Video Games.

If we assume as given we'll eventually live in a society with a UBI (all eligible citizens receive an Unconditional Basic Income, enough to cover their food, clothing and shelter), then the most pressing question is: How should we roll it out?

Years of making Video Games suggest two quick answers:

The easy way is by lottery. Suppose Gary is a winner in the monthly UBI Lottery! Congrats Gary! Gary no longer has to deal with our mess of confusing taxation and welfare regulations. He wins a much simplified UBI and a flat tax. Of course, any change can be scary and difficult, so Gary also has the option to just stick with the old system if he wants.

More interesting is the notion of a Dual Currency. It's a little bit like enrolling in the food stamp program, where he's issued with tokens that can be exchanged for food items at a 1-1 ratio. In a food stamp program, those tokens would normally expire after a set period of time.

Food stamps are really old. Like, 1930's America old. We live in a digital world, so lets make those tokens work more like an energy mechanic in Candy Crush or League of Legends. Those tokens now accrue *continuously* rather than appearing all at once on a Thursday. We'll cap Gary's balance at a maximum of 1 months worth of tokens. Any balance more than 2 weeks of tokens would also have a penalty applied.

Finally pricing. Staples like bread, milk, laundry detergent and cleaning supplies will have a heavily discounted price when purchased using tokens. Healthy options like fruit and vegetables too. Fast food and chocolates might have a premium pricing attached. Lets make it easier for Gary to make good decisions.


Friday 11 November 2016

Brexit, Elections, and population in 2016

Define: “effective political unit”

If politics is the name we give to a group of people making decisions that affect all the members of that group, then we can use “effective political unit” (EPU) as a catch-all name to reference that group.

Your household is an EPU. Your local sports team is an EPU. Your neighborhood and your city are both EPUs, as is your country, and each of your online communities.

We can get a rough feel for the relative size of an EPU by adding the search term "population" and hitting the "I'm feeling lucky" button on google:

EPUSize (million people)
UK65
California35
Scotland5
Quebec8
London (England)8
London (Ontario)0.5
You0.000001
Me0.000001
You & Me together0.000002
USA320
North America (*)580
Singapore6
OECD (*)560
China1350
Eve Online0.4
Alberta4
New Zealand4
Islam1600
World7500
Tokyo14

(*) The OECD includes all of North America, so as with any "I'm feeling lucky" google search, the error bars are large.

A natural question to ask: "Given each Effective Political Unit is a group of people making decisions, what size of EPU is the most successful?" It's hard to pick an exact number, but like many trends associated with people, it's increasing over time, and the rate of increase is increasing:


EPUSize (million people)Year
Toba Catastrophe0.0770,000 BCE
Nomadic tribe0.001prehistory
Ancient Greece5400 BCE
Ptolemaic Egypt7300 BCE
Han dynasty572 CE
Ancient Rome (peak)60160 CE
Mayan city0.1700 CE
Walmart Employees22015 CE


2016


A vote for a protectionist like #Trump favors smaller (USA, 320) over #Clinton's larger (World, 7500).

A #brexit vote favors smaller (UK, 65) over #remain's larger (EU, 500).

A #califrexit (California, 35) is even smaller still.

Which brings us back to the core question of this blogpost: What size of EPU is the most successful?

Historically, every EPU has had a maximum size, once it extends past that point, it is doomed to collapse. At the same time, history is filled with EPUs that were too small, and were out-competed by slightly larger EPUs which were more effective.


It's a classic value judgement.


As social animals, we weigh the perceived risks and benefits between larger EPUs and smaller EPUs, and make a call, then find a post-hoc rationalization for our decision.


What I find fascinating is the schism between younger voters and older voters. If you look into the various exit polls around the world, a clear trend starts to emerge: Older voters seem to be favoring the 10MM-50MM range, while younger voters seem to be consistently voting in support of larger and larger EPUs.

What does it all mean? At the risk of rampant speculation, do younger voters have more confidence in technology to enable larger and larger EPUs? Do older voters have more hands on experience with large EPUs getting out of control and collapsing? I really have nothing to back up either of those statements, but it sure is fun to make sweeping generalizations :D

Let me know your thoughts in the comments down below!

Sunday 9 October 2016

Cheapest 3D Printer

My latest obsession is trying to build a 3D printer for as cheap as possible.

Partly it's because I believe 3D printing is a disruptive technology. The lower the cost for making a 3D printer, the more people will have access to the technology, and sooner the disruption will take place.

And partly, it's because I'm just really really cheap.


Low Cost

What does low cost really mean? One obvious way is to look at the price of something if we were to buy it new in a shop. If we only source new parts and new materials, we're going to have a difficult time creating something truly low cost.

My strategy is different. I'm going to try and get as many of the source materials as possible for "zero dollars."

Consider old car tyres. Any time you can recycle the rubber from an old car tyre into a seesaw or a swing, or into building materials or to protect a wharf, then the cost of that rubber is effectively "zero dollars."

That's why the core design elements of my 3D printer are going to be fishing line and lego. Two very cheap substances if you source them the right way.

Fishing Line

Nylon fishing line is an amazing substance. It's strong. Durable. Inexpensive. It's readily available everywhere around the globe. And if you need small quantities, you can often obtain it for "zero dollars". You probably already have some.

Lego

Lego is an amazing substance. It's available everywhere. It's manufactured to extremely high tolerances. It's consistent across time and place. It comes in a variety of colors. It's durable.
While lego might not be cheap, you can often *borrow* lego for "zero dollars" by using the magic words "I'm trying to make a 3D printer out of lego."
Once your print run is complete, you can simply disassemble the lego and return it to it's previous state.

Calibration Problem

When I look at the designs for existing 3D printers, one of the biggest design considerations seems to be finding out where the extrusion point is in relation to the "bed". Existing designs carefully measure the motion of the motors, try really hard to make the frame rigid, and then have lots of complicated software to try and calculate where exactly the filament is being deposited.

Ack, too difficult.

Why go through all the calculation, when you can measure directly?

My plan is to use the camera on an Android tablet to see where the bed is, and, at the same time, to see where the print head is. If it needs to move to the left, well, the tablet will keep the motors spinning until it lines up. Too far to the right? no problem, spin the motors the other way until it matches. Checkmate calibration problem!

OpenCV


Oh, and remember our lego? We know exactly how large a block is in the real world, so we can measure off distance in our 2D camera space by placing a known lego calibration object made with a few different known colors.

This way it doesn't matter if our fishing line stretches during the course of the print, or our lego gets bumped half way through, or the ambient temperature changes which make the layers a tiny bit thinner.. no problem, the camera on the android tablet sees all.

And how much does it cost for an Android tablet? "zero dollars." You just have to use the magic words: "Can I borrow your Android tablet to make a 3D printer?"

Next Steps

I've already starting on version 1 of the prototype. Watch this space.